
In a perfect world, code never breaks. In the real world, servers crash, APIs time out, and users find ways to break things you never thought possible. When the “Everything is Fine” fire starts, your Error Log is your fire extinguisher.
A good error log doesn’t just tell you that something broke; it tells you why and how to fix it. Here is how to build a logging strategy that turns 3:00 AM outages into 5-minute fixes.
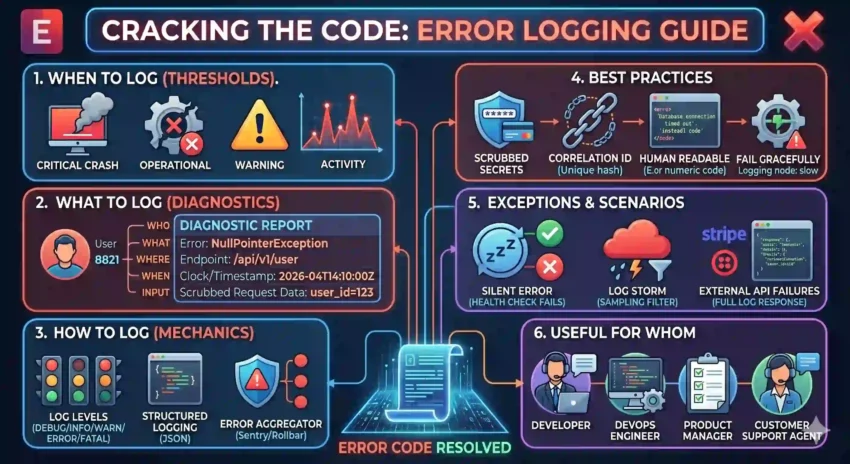
1. When to Log? (The Thresholds)
Not every hiccup is an error. To avoid “Log Fatigue,” you need to categorize based on severity:
-
Fatal/Critical: When the application crashes or a core service (like the database) is unreachable. Log immediately.
-
Errors: When a specific operation fails (e.g., a payment failed or a file didn’t upload) but the rest of the app is still running.
-
Warnings: For “near misses” or strange behavior that isn’t a failure yet—like a deprecated API call or a high memory usage spike.
-
Caught Exceptions: Even if you “handle” an error with a
try-catchblock, you should still log it if it represents an unexpected state.
2. What to Log? (The Diagnostic Data)
A log that says Error: Null Pointer Exception is a riddle, not a report. To debug effectively, your logs should include:
-
Error Message & Type: Clear, human-readable text and the specific exception class.
-
Stack Trace: The breadcrumb trail of code execution leading to the crash.
-
Contextual Metadata:
-
User ID: Who was affected?
-
Request URL/Endpoint: Where did it happen?
-
Input Parameters: What data triggered the error? (Omit sensitive data!).
-
-
Environment Info: Was this on
Production,Staging, orLocal? What version of the app was running?
3. How to Log? (The Mechanics)
Don’t just console.log() and hope for the best. Modern applications require a more robust pipeline:
-
Log Levels: Use standard levels (
DEBUG,INFO,WARN,ERROR,FATAL). This allows you to filter out the noise in production while keeping high-detail logs for development. -
Structured Logging (JSON): Output logs in JSON format. This allows tools like Loggly, Sentry, or Splunk to parse and visualize the data.
-
Error Aggregation: Use a tool (like Sentry or Rollbar) that groups 1,000 instances of the same error into one notification so your inbox doesn’t explode.
4. Best Practices
-
Don’t Log Secrets: This is the #1 rule. Ensure your logging middleware automatically scrubs passwords, API keys, and Credit Card numbers.
-
Context is King: Include a Correlation ID (a unique string for a single request) that travels through all your microservices so you can see the error’s journey.
-
Write for Humans: Instead of
Error 504, writeDatabase connection timed out after 30 seconds. -
Fail Gracefully: Ensure your logging system itself doesn’t crash your app. If the log server is down, the app should keep running.
5. Exceptions and Scenarios
How do you handle these tricky situations?
-
The “Silent” Error: Sometimes code fails but doesn’t throw an exception. Use “Health Checks” to log when a background process hasn’t reported in for a while.
-
The Log Storm: If a database goes down, you might get 10,000 logs per second. Implement Throttling or Sampling to ensure your logging service doesn’t become a bottleneck.
-
External API Failures: When a third-party service (like Stripe or Twilio) fails, log the full response body from them. Usually, their error message is more helpful than yours.
Summary: Useful for Whom?
-
Developers: For rapid debugging and identifying “unreachable” code.
-
DevOps/SREs: To monitor system health and set up “Error Budget” alerts.
-
Product Managers: To understand where users are getting frustrated by “dead ends” in the app.
Pro-Tip: If you find yourself saying “I don’t know why that happened” more than once a week, it’s time to upgrade your error logs.